6Which Information Can You Get from Audiogram?
By looking at an audiogram, you may get the following information about your hearing loss:
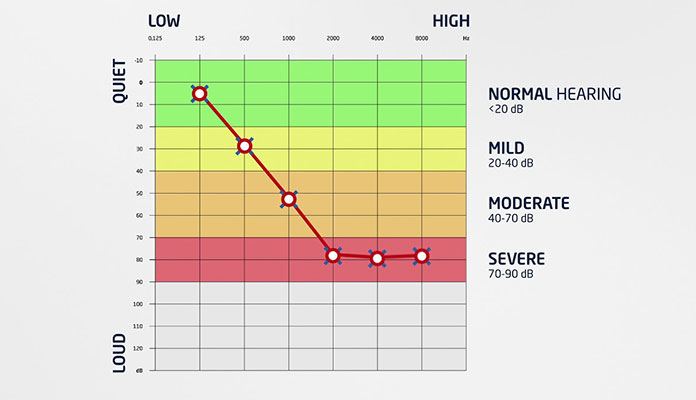
– A line that increases and decreases along the graph suggests hearing loss for specific frequencies
– A steady line that links threshold levels at the top of the graph shows normal hearing
– A line that goes downward at higher frequencies suggests hearing loss due to aging
– A line that is lower on the graph suggests more severe hearing loss
The measures for normal hearing are between -10 dB and 15 dB at every threshold level. [7]